Grid
Updated on 2026-09-03The Grid represents the market in tabular form and by default consists of the following columns: Candlestick Chart Button, Selections, LTP/LTA, Back, WoM, Lay, Scalper, Volume, Chart and Automation.
The number of Back and Lay columns can be set via the Options window in the Grid tab. In the same tab, you can also set which columns to display.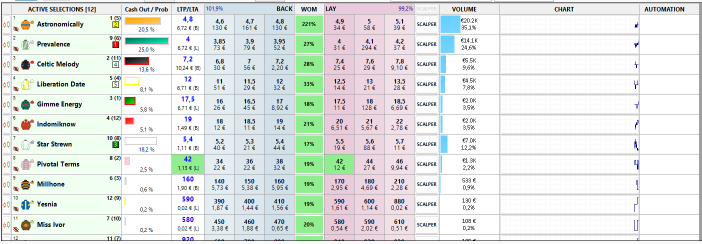
Title Row
The column headers row can be hidden in the Options to maximize the area dedicated to useful trading information.
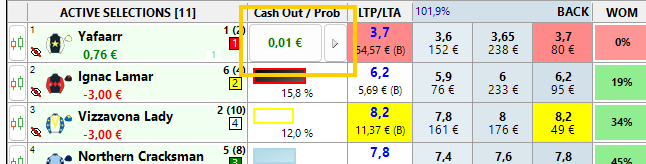
- the numbers inside the colored squares represent the order based on the favorite.
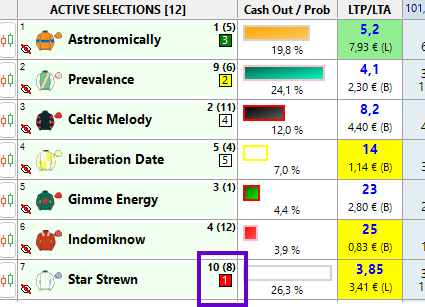
- the numbers in the top left represent the sequential order established by Betfair.
- the crossed-out eye icon allows you to hide individual selections, which are parked at the bottom of the Grid tab and can be reactivated by clicking on their name.
- the numbers in the bottom right represent the bets placed on the selection (pending, partially matched, fully matched).
- the profit/loss values that will be realized if that selection wins are displayed below the selection name.

Please note that this value has different meaning respect the number of winners of the market:
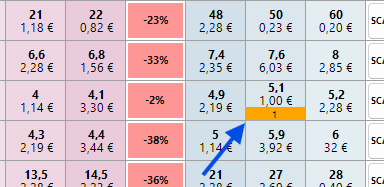
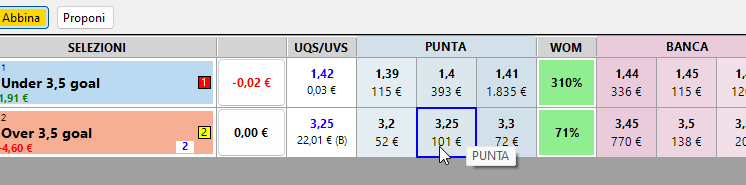
- in markets with one winner, if the mouse is hovered over the placement area, the area described above shows the expected profit/loss value is displayed after the bet being placed is matched.
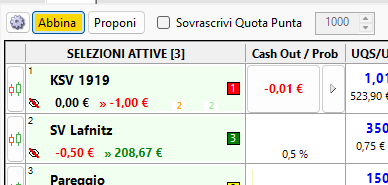
- If the market allows more than one winner (for example, Double Chance markets), it is not possible to specify the profit that will be obtained if a particular selection wins, because the actual profit will also depend on which other selections are winners. In this case, XTrader calculates all possible combinations of winning selections that include the selection in question and displays the range of expected outcomes based on the resulting combination of winning selections. In these cases, the prediction on mouse hover is not calculated.
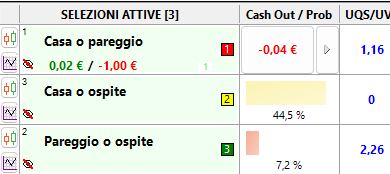
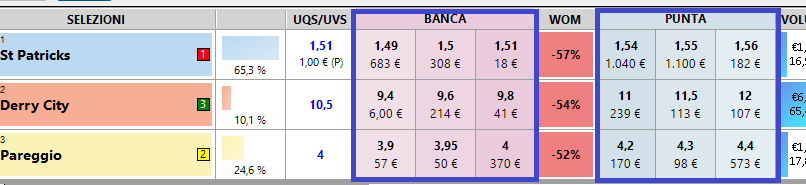
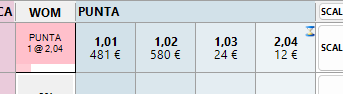
The Scalper column title contains an additional button that allows you to simultaneously perform the operation on all visible selections in the book (it will not be performed on hidden selections). This button acts immediately without confirmation, so it is inactive if the bet confirmation option is not enabled.
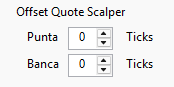
The Automation column contains the Strategy Application Control, which allows you to apply/disapply, start, and stop strategies on the market.
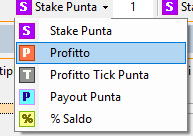
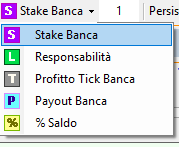
- if the stake buttons are active, the stake currently selected in the stake buttons
- if the stake buttons are inactive, the stake selected in the top bar of the main window
Please read this page for detailed information about the stake calculation variants.